Kubernetes has taken the container orchestration world by storm. It makes the complex task of multi-tenet application and service deployment easier and more accessible to teams. But underneath is a non-trivial set of components that must be configured and tuned to operate smoothly. Container networking can be complex and management of a container network is vital to application health. Using the Container Network Interface that provides a framework for interfacing network providers with pod networking, containers can communicate using a variety of methods including VXLAN or BGP. As application density increases, so does the complexity of identifying what network resources are being utilized, how much data is being sent and received, and where is the traffic going.
Convis is Kentik Labs' open source container visibility tool that uses BPF to identify network traffic. Using Convis, we can add context to the traffic to attribute the Kubernetes namespace, pod, and container information. Using a few Kubernetes constructs we can create a powerful system to visualize application traffic across our platform with no modifications or application changes.
To enable the gathering of BPF level information for the traffic and pod, we will create a DaemonSet that will schedule Convis on every one of our worker nodes.
apiVersion: apps/v1
kind: DaemonSet
spec:
  template:
    spec:
      hostPID: true
      containers:
        - name: convis
          image: docker.io/kentiklabs/convis:latest
          env:
            - name: CONVIS_ARGS
              value: "--sink prometheus,endpoint=http://prometheus:9090/api/v1/write"
          securityContext:
            privileged: true
Notably to the mostly standard DaemonSet configuration are a couple of things.
First we will use the hostPID configuration option to set the container to run
in the host PID namespace. We also configure the pod to be privileged
to enable access to host level resources like devices and networking.
To provide simple location based information for the reported IP addresses from Convis we will create a Deployment and Service that will expose a metrics endpoint that can be scraped for the location data.
apiVersion: apps/v1
kind: Deployment
spec:
  template:
    spec:
      containers:
        - name: geoip
          image: docker.io/kentiklabs/prometheus-geoip:latest
          env:
            - name: QUERY
              value: "sum by (k8s_namespace, k8s_pod, destination_ip) (bytes_tx{})"
          command: [
            "/usr/local/bin/prometheus-geoip",
            "-D", "-p", "http://prometheus:9090",
            "-i", "destination_ip",
            "-d", "/etc/GeoLite2-City.mmdb",
            "-l", "k8s_namespace",
            "-l",
            "k8s_pod",
          ]
          ports:
          - containerPort: 8080
            name: geoip
---
apiVersion: v1
kind: Service
spec:
  ports:
    - name: geoip
      port: 8080
      targetPort: 8080
      protocol: TCP
This service will query Prometheus using the QUERY to add Geo latitude and longitude
information for each reported IP address.
Next we will configure a Deployment for Prometheus to receive the network data from Convis. We will also leverage a ConfigMap for the Prometheus configuration. This configures Prometheus to scrape the GeoIP service to gather basic location information for the reported IP addresses.
apiVersion: v1
kind: ConfigMap
data:
  prometheus.yml: |
    global:
      scrape_interval: 10s
    rule_files:
      - '/etc/rules/rules.yml'
    scrape_configs:
      - job_name: 'geo'
        static_configs:
          - targets: [
              'geoip:8080',
            ]
---
apiVersion: apps/v1
kind: Deployment
spec:
  template:
    spec:
      containers:
        - name: prometheus
          image: docker.io/prom/prometheus:v2.30.0
          command: [
            "/bin/prometheus",
            "--config.file=/etc/prometheus/prometheus.yml",
            "--storage.tsdb.path=/prometheus",
            "--web.console.libraries=/usr/share/prometheus/console_libraries",
            "--web.console.templates=/usr/share/prometheus/consoles/prometheus",
            "--enable-feature=remote-write-receiver",
          ]
          ports:
          - containerPort: 9090
            name: prometheus
---
apiVersion: v1
kind: Service
spec:
  ports:
    - name: prometheus
      port: 9090
      targetPort: prometheus
      protocol: TCP
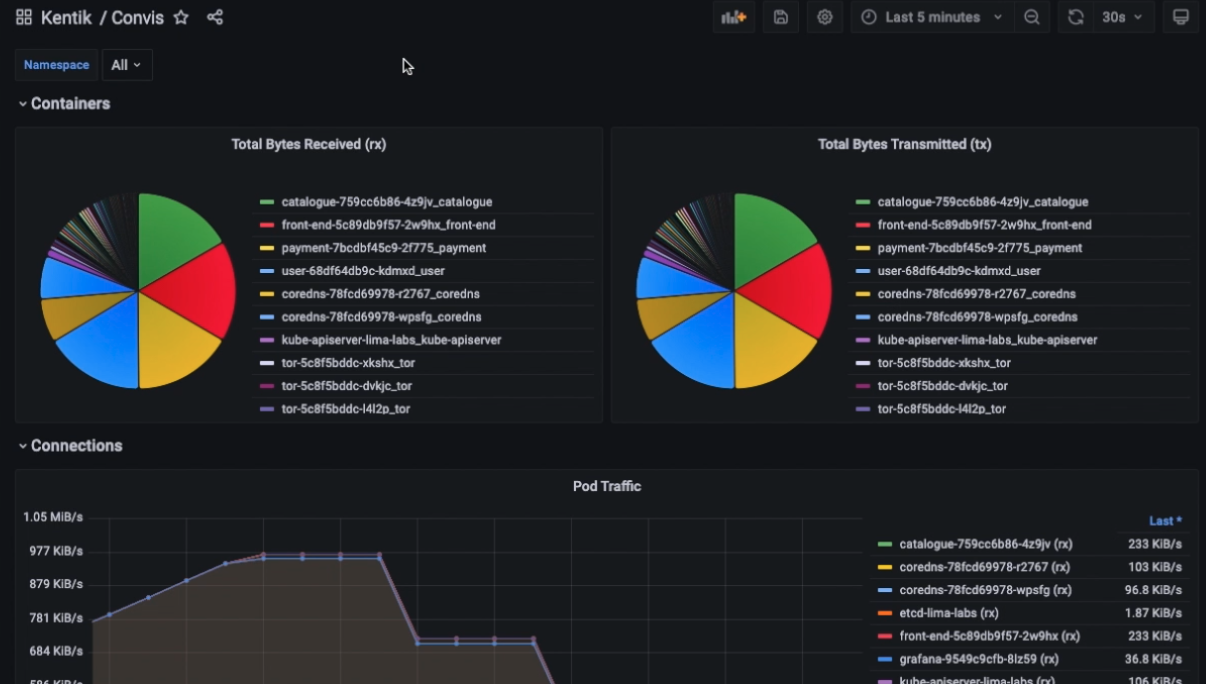
We will also create a Grafana deployment to have some graphical visualizations for the Kubernetes traffic.
apiVersion: apps/v1
kind: Deployment
spec:
  template:
    spec:
      containers:
        - name: grafana
          image: docker.io/grafana/grafana:8.1.4
          ports:
          - name: grafana
            containerPort: 3000
---
apiVersion: v1
kind: Service
spec:
  ports:
    - name: grafana
      port: 3000
      targetPort: 3000
      protocol: TCP
Using Grafana, we can create some powerful dashboards to show and filter Kubernetes traffic by Namespace, Pod, and Container.
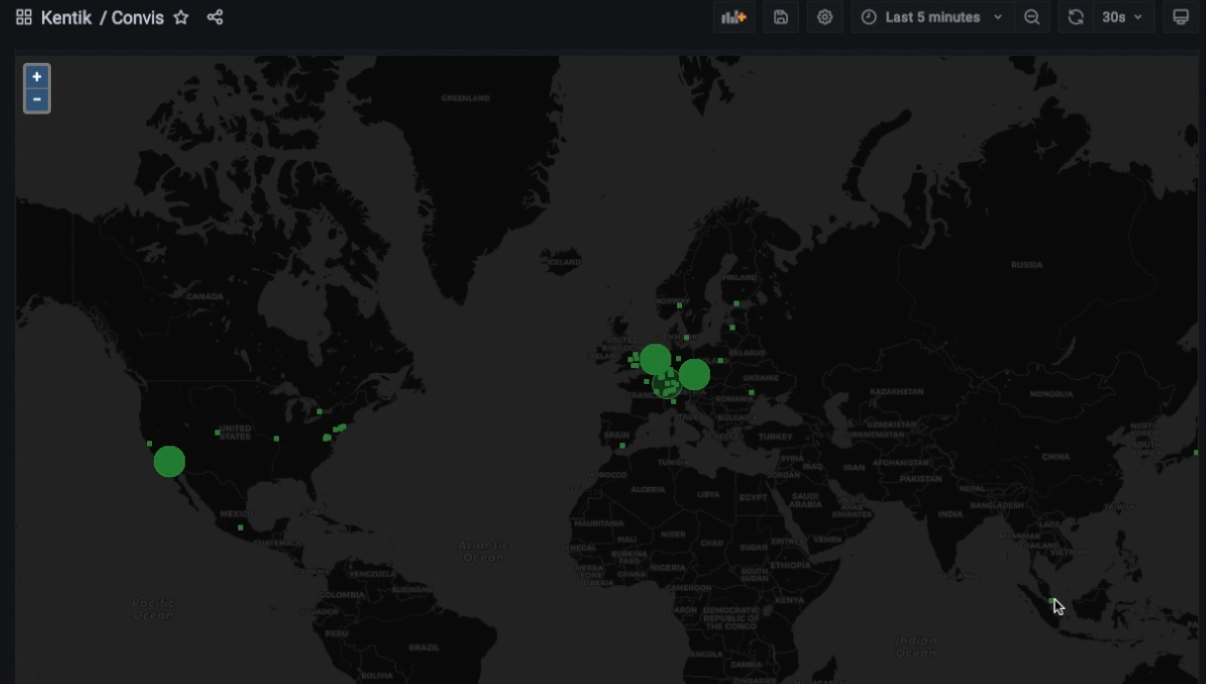
We can also use the GeoIP information to visualize external traffic. This is incredibly valuable in identifying rogue connections to locations that are not expected or forbidden.
You can find the Kentik Labs stack on GitHub to deploy it on your own infra.
Open Source
If this is interesting to you please join us on GitHub and Discord to help build the future of open source network observability!