Ensuring your application is available, healthy, and performant is vital for any production service. Monitoring and observability critical component to notify when an application has an issue but what about the data leading up to that threshold? Synthetics give you continuous data points on the factors that matter most to your application whether it be a simple TCP ping, an HTTP status, or network trace. Does your application have increasing load times between application versions? Is there a spike in traffic at certain hours that trigger slower responses? Are there other processes that are running that are negatively affecting the service but not to the point where it falls over? As Kubernetes use increases, neighboring applications can cause significant issues if not configured properly. When synthetics are used in combination with your monitoring and observability stacks, they provide a powerful view into the overall health of the application and help identify issues before they cause an outage.
Synthetics
Synthetics provide a way of simulating real user actions in a variety of ways. This provides insight into real-world usage of your applications and services whether it be network availability, DNS resolution, or server response times to name a few.
Kubernetes is intended to streamline deployment and application management. By design it enables faster delivery by hiding the complexity of the underlying infrastructure allowing teams to deploy using a common language. This gives teams more control over their application development and lifecycle but also means the responsibility for ensuring application health is largely on them. In an ideal scenario the team would instrument applications and services to both observe and continuously check health but in reality we know that is not always the case. Does the team want to own their observability stack? Probably not. That means they are now responsible for both the application and a subset of critical path infrastructure. Using a cloud service for that part of the application is common but how can we ensure that teams are using a common service for testing and observing application health without putting the burden of management on them as well?
Odyssey
Odyssey is a simple Kubernetes operator that automates agent provisioning and configuration for a synthetic test framework in a Kubernetes cluster. The operator pattern enables developers to extend Kubernetes for their own applications and still follow the Kubernetes principles. When used with Kentik Synthetics, this gives a number of benefits:
- Standard synthetic platform for all teams
- Operator controlled base framework
- Cloud provider access managed by operator not team
- Developers focus on writing checks not managing infra
Operators deploy and manage the Odyssey operator enabling teams to focus on writing tests. It also improves security by keeping provider credentials at the controller level and not alongside the application. By leveraging the teams existing Kubernetes knowledge they have a much more familiar and simpler method to add synthetic checks to their applications.
Checks
Once Odyssey is deployed, adding checks to an application or service is simple and familiar. Odyssey provides a custom resource to enable simple check creation. Let’s look at how to add a simple HTTP check to an application:
apiVersion: apps/v1
kind: Deployment
metadata:
  name: demo
  labels:
    app: demo
spec:
  replicas: 3
  selector:
    matchLabels:
      app: demo
  template:
    metadata:
      labels:
        app: demo
    spec:
      containers:
      - name: demo
        image: docker.io/ehazlett/sysinfo:latest
        ports:
          - containerPort: 8080
            name: app

---
apiVersion: v1
kind: Service
metadata:
  name: demo
  labels:
    app: demo
spec:
  selector:
    app: demo
  ports:
    - name: app
      port: 8080
      targetPort: app
      protocol: TCP
The above is a simple web service that provides node information. It contains a deployment with three replicas that each
run a pod that provides a web service on port 8080. There is also a Kubernetes service that provides access
to the pods also on port 8080. Now let’s look at adding an Odyssey check to the application that performs a simple
GET:
apiVersion: synthetics.kentiklabs.com/v1
kind: SyntheticTask
metadata:
  name: demo
spec:
  fetch:
    - service: demo
      target: /
      port: 8080
      method: GET
      period: 10s
      expiry: 5s
That’s it. When the controller detects this resource is created, it will configure the agent to perform a fetch to the
service demo on port 8080 every 10 seconds. Odyssey automatically resolves the demo service endpoint making the
check work on any environment.
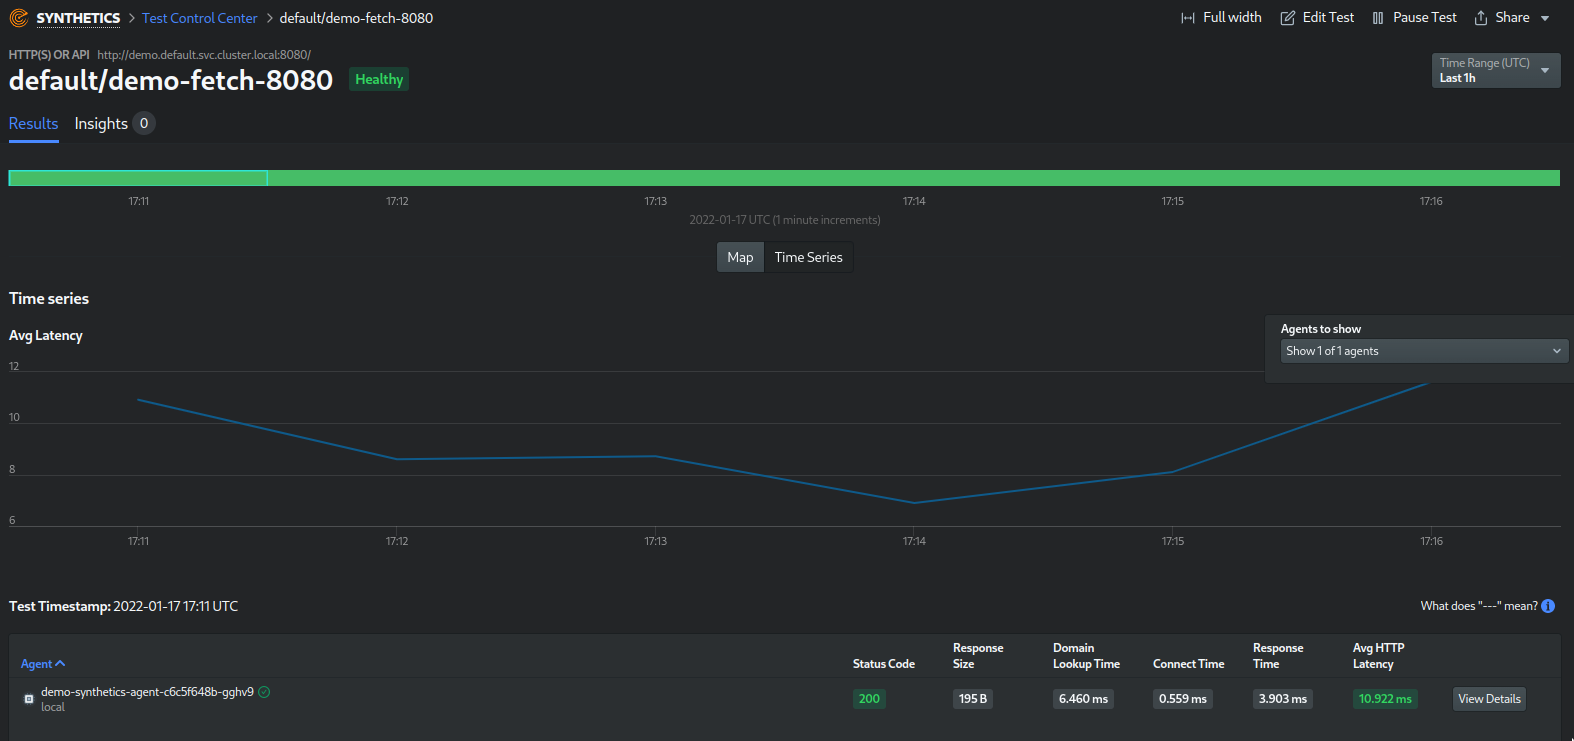
Once we have defined our checks we can view them in the Kentik Portal. This gives teams a powerful tool to see application health, service availability, performance metrics between deployments, and more.
Odyssey gives teams a simple and powerful way to add synthetic checks to applications. For more information join us on GitHub and Discord to help build the future of open source network observability!